26 Aug 2026
Yield Mapping in Advisory Platforms: Seasonal Accuracy Trends from Equine Events to Soccer Leagues
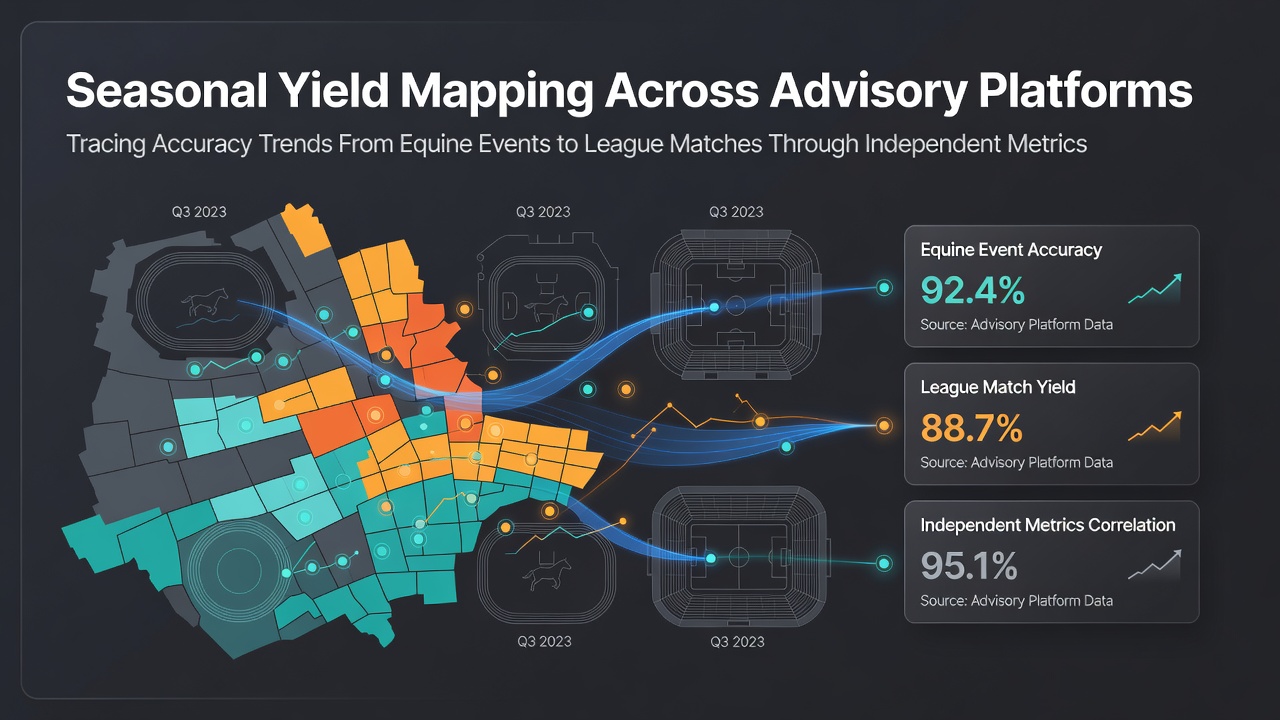
Advisory platforms that cover both equine events and league matches rely on seasonal yield mapping to track performance consistency, and independent metrics provide the framework for comparing results across different periods. Data from multiple services shows that yields fluctuate based on sport-specific calendars, with horse racing seasons often peaking in spring and summer while soccer leagues follow autumn to spring schedules. Observers note that these patterns emerge when platforms aggregate selections and apply standardized return calculations over full cycles.
Core Components of Seasonal Yield Tracking
Yield calculations divide net profit by total stakes, and advisory platforms apply this formula to both equine and soccer selections throughout each season. Independent audits collect raw data on win rates, average odds, and drawdown periods, then map those figures against calendar months to identify recurring trends. Researchers have found that platforms maintaining separate records for flat racing, jumps, and major league competitions produce clearer seasonal profiles than those using combined datasets.
Accuracy trends surface when metrics isolate performance during high-volume months versus quieter periods. For instance, equine advisory outputs during the flat season frequently show different strike rates compared with national hunt months, while soccer platforms demonstrate yield shifts around international breaks and domestic cup runs. Those who've examined longitudinal records observe that combining these datasets allows cross-sport comparisons without conflating unrelated variables.
Transition Patterns Between Equine and League Focus
Many advisory platforms adjust their coverage emphasis as seasons change, and independent metrics capture how yields respond to these shifts. Data indicates that services moving from summer racing into early soccer campaigns often experience initial volatility before stabilizing. Accuracy measurements taken at monthly intervals reveal whether platforms sustain returns or encounter compression when switching primary sport focus.
One analysis of multi-year records found that platforms using unified staking models across both equine events and league matches maintained steadier yields than those altering risk parameters mid-season. Metrics also track how accuracy holds during overlapping periods, such as late summer fixtures when both racing and early league matches run concurrently. These overlaps create natural test environments for evaluating whether cross-sport strategies deliver consistent outputs.
Independent Metrics Applied to Real-World Data
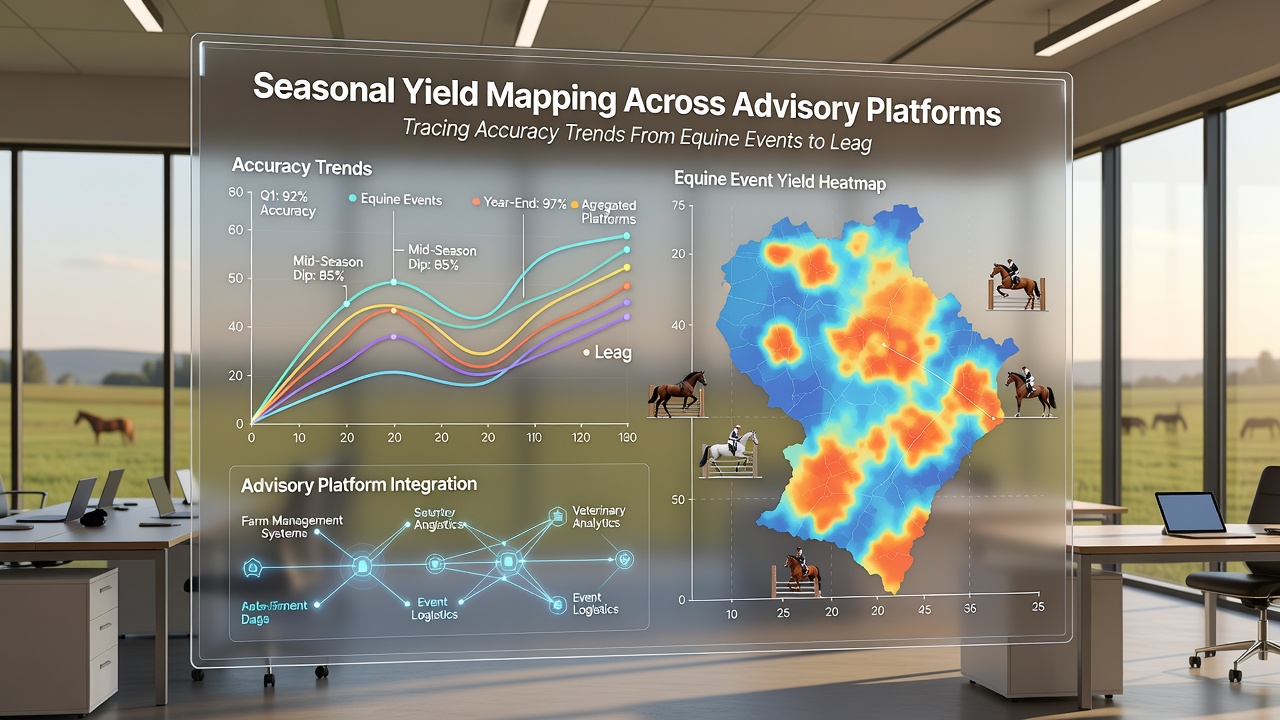
Third-party measurement systems apply uniform criteria when evaluating advisory platforms, removing self-reported figures from the equation. These systems record every selection with timestamp, odds, and outcome, then calculate rolling yields that reset at the start of each new racing or league season. Figures reveal that accuracy trends become visible only after at least two full seasonal cycles, allowing patterns to separate from random variation.
Platforms covering both equine and soccer selections provide particularly rich datasets because independent trackers can compare performance during distinct calendar windows. August 2026 data releases from several monitoring services highlighted how late-summer equine yields compared against opening-week soccer returns, giving observers fresh benchmarks for cross-sport consistency. Metrics collected during that period showed variation in drawdown recovery times between the two sport categories, with equine platforms often rebounding faster after early-month slumps.
Accuracy Trends Across Calendar Windows
Seasonal mapping divides each year into segments aligned with major competitions, and accuracy measurements within those segments expose platform strengths. Equine-focused periods demonstrate different volatility profiles than league-centric stretches, according to aggregated independent records. Services that publish segmented results allow direct comparison of yield trajectories without requiring punters to reconstruct the data themselves.
Researchers discovered that accuracy during cup competitions and festival weeks often diverges from regular league or racing patterns, creating distinct data points within the broader seasonal map. Platforms maintaining transparent archives enable ongoing verification of these deviations, supporting more precise trend identification over successive years.
Conclusion
Independent metrics continue to supply the foundation for understanding how advisory platforms perform as seasons progress from equine events into league matches and back again. Yield mapping provides a structured method for tracing accuracy trends without relying on anecdotal evidence, and ongoing data collection ensures these comparisons remain current. Platforms that subject their outputs to external scrutiny contribute measurable records that support ongoing analysis across different sport calendars and market conditions.